 |
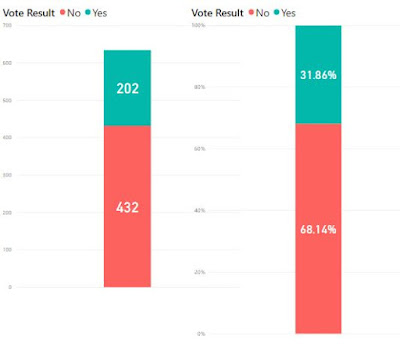
| Fig. 1: Distribution of votes |
 |
| Fig.2: Distribution by MP's gender |
 |
| Fig. 3: Distribution of votes in UK |
 |
| Fig. 4: Distribution of votes in London |
How I did it?
One of the recent and famous parliamentary events was the vote for acceptance of the Brexit contract proposed by Theresa May.
The contract was rejected undoubtfully with 432 No's agains 202 Yes'es.
However, I haven't heard any other statistical info about it.
So, I decided to check and see for myself what kind of MPs voted No and who voted Yes.
I decided to use Microsoft PowerBI and test it directly on JSON source.
As most of the big info sites, the UK Parliament site provides public access to their data thru an API: http://www.data.parliament.uk/
Exactly what I needed.
Members
First, I got a list of all MPs:
As they are about 4.5k members (some of which MPs), I had to do it in 5 parts.
By using parameters (_pageSize and _page) one can specify how much of a data to extract from the API.
I found that using limit of 1000 was most efficient.
I downloaded the 5 files and joined them into one big: members.json
Then I used this file straight as my first source.
Votes
Then there is an API which shows you all Parliamentary sessions in the House of Commons.
Looking by date, I found the ID of the session I was interested: "European Union (Withdrawal) Act main Motion (Prime Minister)" with ID: 1041567
As there were about 600 votes, I was able to extract them all with one call to the API:
I saved the JSON and used it as the second source in PowerBI.
Votes details (View)
Now, we need to join these two sources.
To makes things secure I did a left join.
I want all rows from Votes and only those rows which match from Members.
In practice, all Votes should have a row in Members, but just in case there aren't I use this type of join.
It took me a bit of time, but with some websearch I managed to write a left join formula, which returns me only the fields I'm interested into for the moment:
Both data sets contain the ID number of the member.
In Votes, there is a field containing the result of the vote (Yes, No) and the Member ID.
In Members source, there is field containing the Member ID, Name of consituency (Geo Area) and Gender.
I used this view to create the Map and Gender distribution of votes.
Using JSON as a source in PowerBI is easy, however takes time to get used to where to click and what to do.
I'll not go into details how to do it here.
Essentially, it is expansion of fields and use of simple string function to format the values.
In a nice way, PowerBI saves all your transformations in a script and essentially executes them every time the data sources are refreshed.


No comments:
Post a Comment